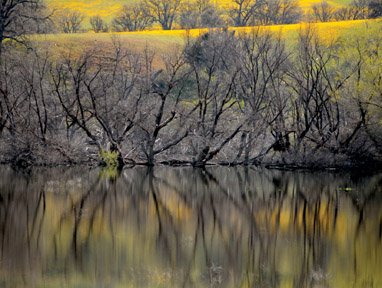
Data from the state department of water resources revealed the nearby San Luis Reservoir was at 80 percent of its total capacity and Hernandez Reservoir in San Benito County was about 40 percent full.
As of Thursday, San Luis was storing 1,633,540 acre-feet of water, which is 104 percent of the historical average for that date. The reservoir has a total capacity of 2,041,000 acre-feet.
Meanwhile, the local Hernandez Reservoir was 39 percent full in the data.
“Our local reservoir, Hernandez in South County, has about 7,000 acre-feet of water,” said County Water Resources Association Conservation Program Manager Shawn Novack. “It’s capacity is close to 18,000 acre-feet. The other reservoir, San Justo off of Union Road, holds federal water from San Luis. It’s getting close to full with carry over water.”
In other words, recent rainfall helped restore nearby reservoirs, crucial toward maintaining a healthy supply of water. Still, groundwater levels in a recent report show the area could probably use more precipitation.
That’s according to the annual groundwater report by the San Benito County Water District and data from the California Department of Water Resources. That report issued Jan. 9, however, wouldn’t have taken into account massive storms that recently hit the area.
“Water Year 2016 may be the beginning of a slow recovery from the long-term drought that the District and state has experienced; precipitation was above normal for the first time since 2011,” the report stated.
Overall precipitation in 2016 was 14.9 inches, the report said. That’s above the long-term average of 12.9 inches from years 1875 to 2016. Last year was the first above-average rainfall year since 2011.
Novack said it will take more than this rainy season to refill state aquifers and reservoirs.
“The state has lost so much water over the past several years that it will take more than this season to refill aquifers and reservoirs,” Novack said. “The state is also expected to see a rising population and, therefore, more water demand and increased climate uncertainty in the future.”
According to the water district’s report, other factors beyond precipitation that determine the length of recovery include groundwater use, pattern and intensity of rainfall, local geology, and managed recharge activities like wastewater percolation.
Technical details
The report detailed water use in Water Year 2016 for Zone 6, comprised of the Bolsa South East, Hollister East, Hollister West, Pacheco, San Juan and Tres Pinos subbasins.
“In October 2016, groundwater levels continued to decline in areas of the basin that rely on groundwater, specifically in the Bolsa, San Juan, Hollister West, Bolsa SE, and Tres Pinos subbasins,” the report states. “While some subbasins showed groundwater level increases, overall groundwater in storage decreased. Groundwater elevation declines and storage decreases during drought do not constitute overdraft; nevertheless, the continued reduced supplies of imported water in tandem with increased groundwater demands are a warning of potential overdraft.”
Total water use in Zone 6 during Water Year 2016 was 40,008 acre-feet. The total groundwater acre-feet used was 33,163, with 27,912 acre-feet used for agriculture and 5,251 acre-feet used for domestic and municipal.
According to the report, the San Juan subbasin used the most groundwater for agriculture (13,084 acre-feet), but the Hollister West subbasin used the most groundwater for domestic and municipal (1,996 acre-feet).
“In 2016, groundwater represented 83 percent of total supply, again mostly due to increases in groundwater pumping for agricultural use,” the report stated. “While the percent of supply from groundwater is less than 2015 (86 percent), it remains a much larger portion of total supply than the period of record.”
A figure in the report showed that groundwater has averaged only 62 percent of the supply since 1991, but has increased over time due to drought and reduced Central Valley Project allocations. Central Valley Project allocations are state allocations of irrigation and municipal water that’s taken from northern, water-rich reservoirs and transported to the San Joaquin Valley.
“Agricultural irrigation has represented most water use, ranging from 71 to 90 percent of total demand,” the report read. “In 2016, this sector represented 81 percent of demand. Groundwater for agriculture use is the highest water use/water source combination in most years, averaging 46 percent of total demand from 1988 through 2016. In 2016, groundwater use for agriculture represented 70 percent of the total water use. With the exception of last year, groundwater for agriculture uses is the highest portion of total water use since 1988.”
A pie chart included in the report showed local agriculture uses 70 percent of groundwater, 11 percent of CVP water and 0 percent of recycled water. Domestic and municipal use 5 percent Central Valley water, 13 percent groundwater and 1 percent recycled water.
Water year 2016 was the first year in which recycled water was delivered to both agriculture and municipal customers, the report states.
The report made it clear that it will take more rainfall to replenish local groundwater levels.
“In 2016, groundwater storage was reduced significantly in parts of the basin due to increased groundwater use in a context of years of extreme drought and reduced CVP allocations,” the report stated. “Years of abundant rainfall and restored CVP supply will be needed to replenish the groundwater.”


