The proposed changes in water rates at the Hollister and Sunnyslope Water Districts modify the fixed price, tier price, and tier steps over several of years. This makes forecasting of water bills difficult for the average homeowner.
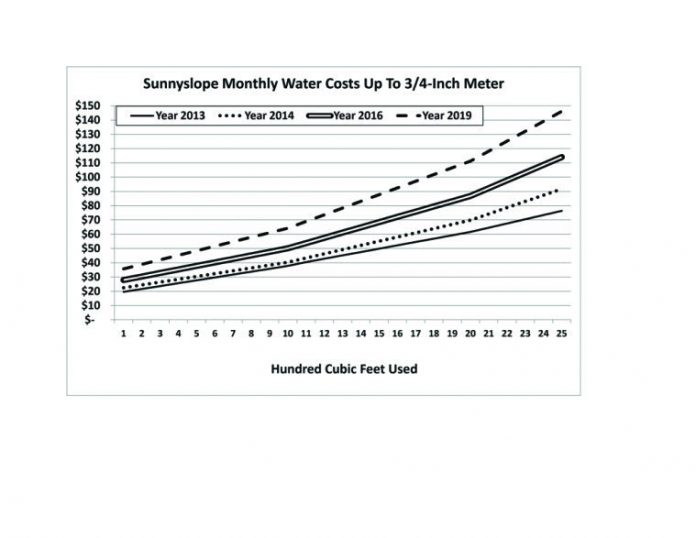
To aid consumers The Free Lance has prepared charts for single-family homes in each distinct showing the approximate current (July 2013) cost of water, and the cost in 2014, 2016, and 2019. They are only estimates for typical homes and are based on monthly use in HCF (Hundred Cubic Feet). A hundred cubic feet is about 748 gallons of water. Important, the charts do not include the sewer fees.
Since the cost is affected by the tier pricing, averaging the entire year’s use does not give accurate results.
How to use the charts: Check your water bill to determine how many HFC you use in a given month. Go to the chart for your water district – Hollister or Sunnyslope. Find your use rate across the bottom and go up until you cross the year you want to estimate. The scale on the left will show the approximate cost for that month’s use in the future.
Example: If your water bill for July 2013 shows a use of 12 HCF and you are served by the Hollister Water District go to the Hollister chart. Go across the bottom to 12 and then go up. Your current bill (2013) should be about $34. Follow up, 2016 will be about $47. In 2019 the fee will be about $60 for the same amount of water use.


