San Benito is home to the ‘creeping’ San Andreas and Calaveras
Faults
San Benito County might really be the earthquake capital of
California.
”
Total energy release is not quite up to what you see in
Mendocino, where the San Andreas [Fault] goes off shore,
”
said Steve Walter, a geologist with the United States Geological
Survey.
”
They have 5,6,7 [magnitude], but day to day I would say the San
Andreas and Calaveras through San Benito have the most noticed
earthquakes.
”
San Benito is home to the ‘creeping’ San Andreas and Calaveras Faults
San Benito County might really be the earthquake capital of California.
“Total energy release is not quite up to what you see in Mendocino, where the San Andreas [Fault] goes off shore,” said Steve Walter, a geologist with the United States Geological Survey. “They have 5,6,7 [magnitude], but day to day I would say the San Andreas and Calaveras through San Benito have the most noticed earthquakes.”
As Walter describes it, San Benito is a divergence of faults. The San Andreas comes up from the south and other faults break off from it. The two major faults that run through San Benito County include the San Andreas and the Calaveras. Other faults in the greater Bay Area include the San Gregorio, which crosses the ocean along the Monterey Bay; the Hayward, which runs across the East Bay, the Mt. Diablo Thrust Fault, Concord-Green Valley Fault and the Greenville Fault further to the east; and the Rodgers Creek Fault through Santa Rosa.
“It seems like nobody is more than seven or eight miles from those faults,” Walter said, of living in the Bay Area.
The portions of the Calaveras and San Andreas faults that run through San Benito County, however, tend to be frequently active at lower intensities.
“If there is any question of where to live along the San Andreas Fault, that’s it,” he said. “It’s the part of the San Andreas that we wish all faults would behave like.”
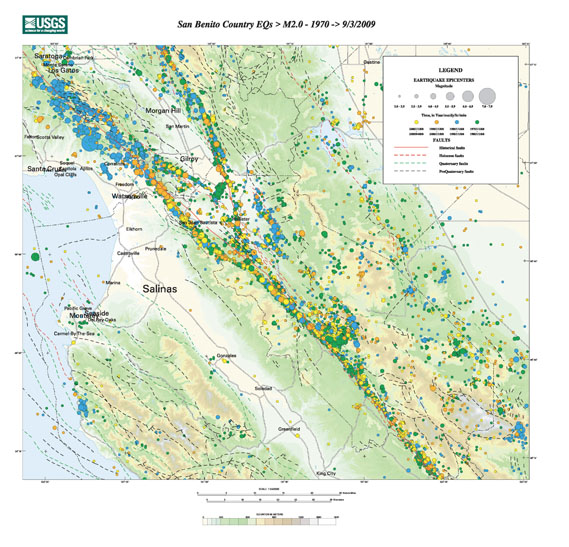
On a recent afternoon Walter pulled up a map of all the earthquakes over 2.0 magnitude that have occurred in San Benito county since 1970. The result is a map full of colored circles to show the decade of the quake and different sizes to show the magnitude. The map reiterates two facts about San Benito that scientists know to be true. The activity along the fault is regular, with dozens of quakes occurring each week. But the quakes tend to be small in size, rarely reaching more than 4.0. The map does not even track the multitudes of 0.0-1.9 quakes that happen each week.
“San Benito is kind of unusual,” Walters said.
In San Benito, the faults are what scientists describe as creeping faults, meaning the plates move slowly against each other and don’t jam up.
“A strong fault with high friction would have a big earthquake, with less frequency,” Walter said. “Like the Loma Prieta [earthquake]. There are no earthquakes day to day, but every 50 to 80 years they have a big one when the rocks can’t take any more strain and they fail in a larger way.”
That is not to say that San Benito County wouldn’t be affected by other earthquakes epicentered outside its limits along stronger faults. That is exactly what happened with the 1989 Loma Prieta earthquake that was epicentered in the Santa Cruz Mountains. Though it was more than 30 miles from Hollister’s city center, blocks of buildings were left in rubble.
“Hollister is in a sedimentary valley, and that, we know for sure, amplifies the shaking,” Walter said. “The best example of that would be Santa Rosa in 1906. The epicenter was off the Golden Gate Bridge, and the energy was trapped in the base. The [valley] was shaking so bad, basically all the brick buildings were destroyed.”
Walter explained that earthquakes also have directionality, so the force of the quakes does not go out in uniform waves from the epicenter.
“It can have an increased intensity along certain areas, depending on how the fault ruptured,” he said.
Since the Loma Prieta earthquake 20 years ago, scientists have worked to understand better how individuals feel the intensity of a quake to help them better predict the areas that will suffer the most damage. On the United States Geological Survey Web site, visitors can log on to the “Did you feel it?” map to describe the intensity at which they felt a quake. The scientists then compare that input to the actual intensity recorded by their digital seismometers that can also be viewed online as a shake map.
Walter said Dave Walt, the scientist who developed the program, looks at the input to confirm or show weaknesses in the shake map.
“In some areas, we have a good handle [of what the shaking will be like,]” Walter said. “In other areas we have to infer what it is based on the ‘Did you feel it?'”
The other major development in recent years is that the United States Congress has dedicated funding to create an advanced seismic net, and to put in more digital seismometers.
“We tend to initially put them in along the San Andreas because that is where the earthquakes are,” he said. “We want the instruments around the area that is going to produce the earthquakes.”


